6.8 EMP_GSEA_analysis
Gene Set Enrichment Analysis (GSEA) involves comparing genes from a gene set of interest to genes in predefined gene sets (often derived from functional annotations or previous experiments). The genes of interest are ranked by a calculated score, creating a ranked list. GSEA then assesses whether the genes in the predefined gene sets are randomly distributed or tend to cluster at the top or bottom of this list. Clustering at the extremes indicates that the predefined gene sets contribute to the observed phenotype differences. GSEA ranking methods include those based on signal-to-noise ratios, correlation results, and difference analysis results.
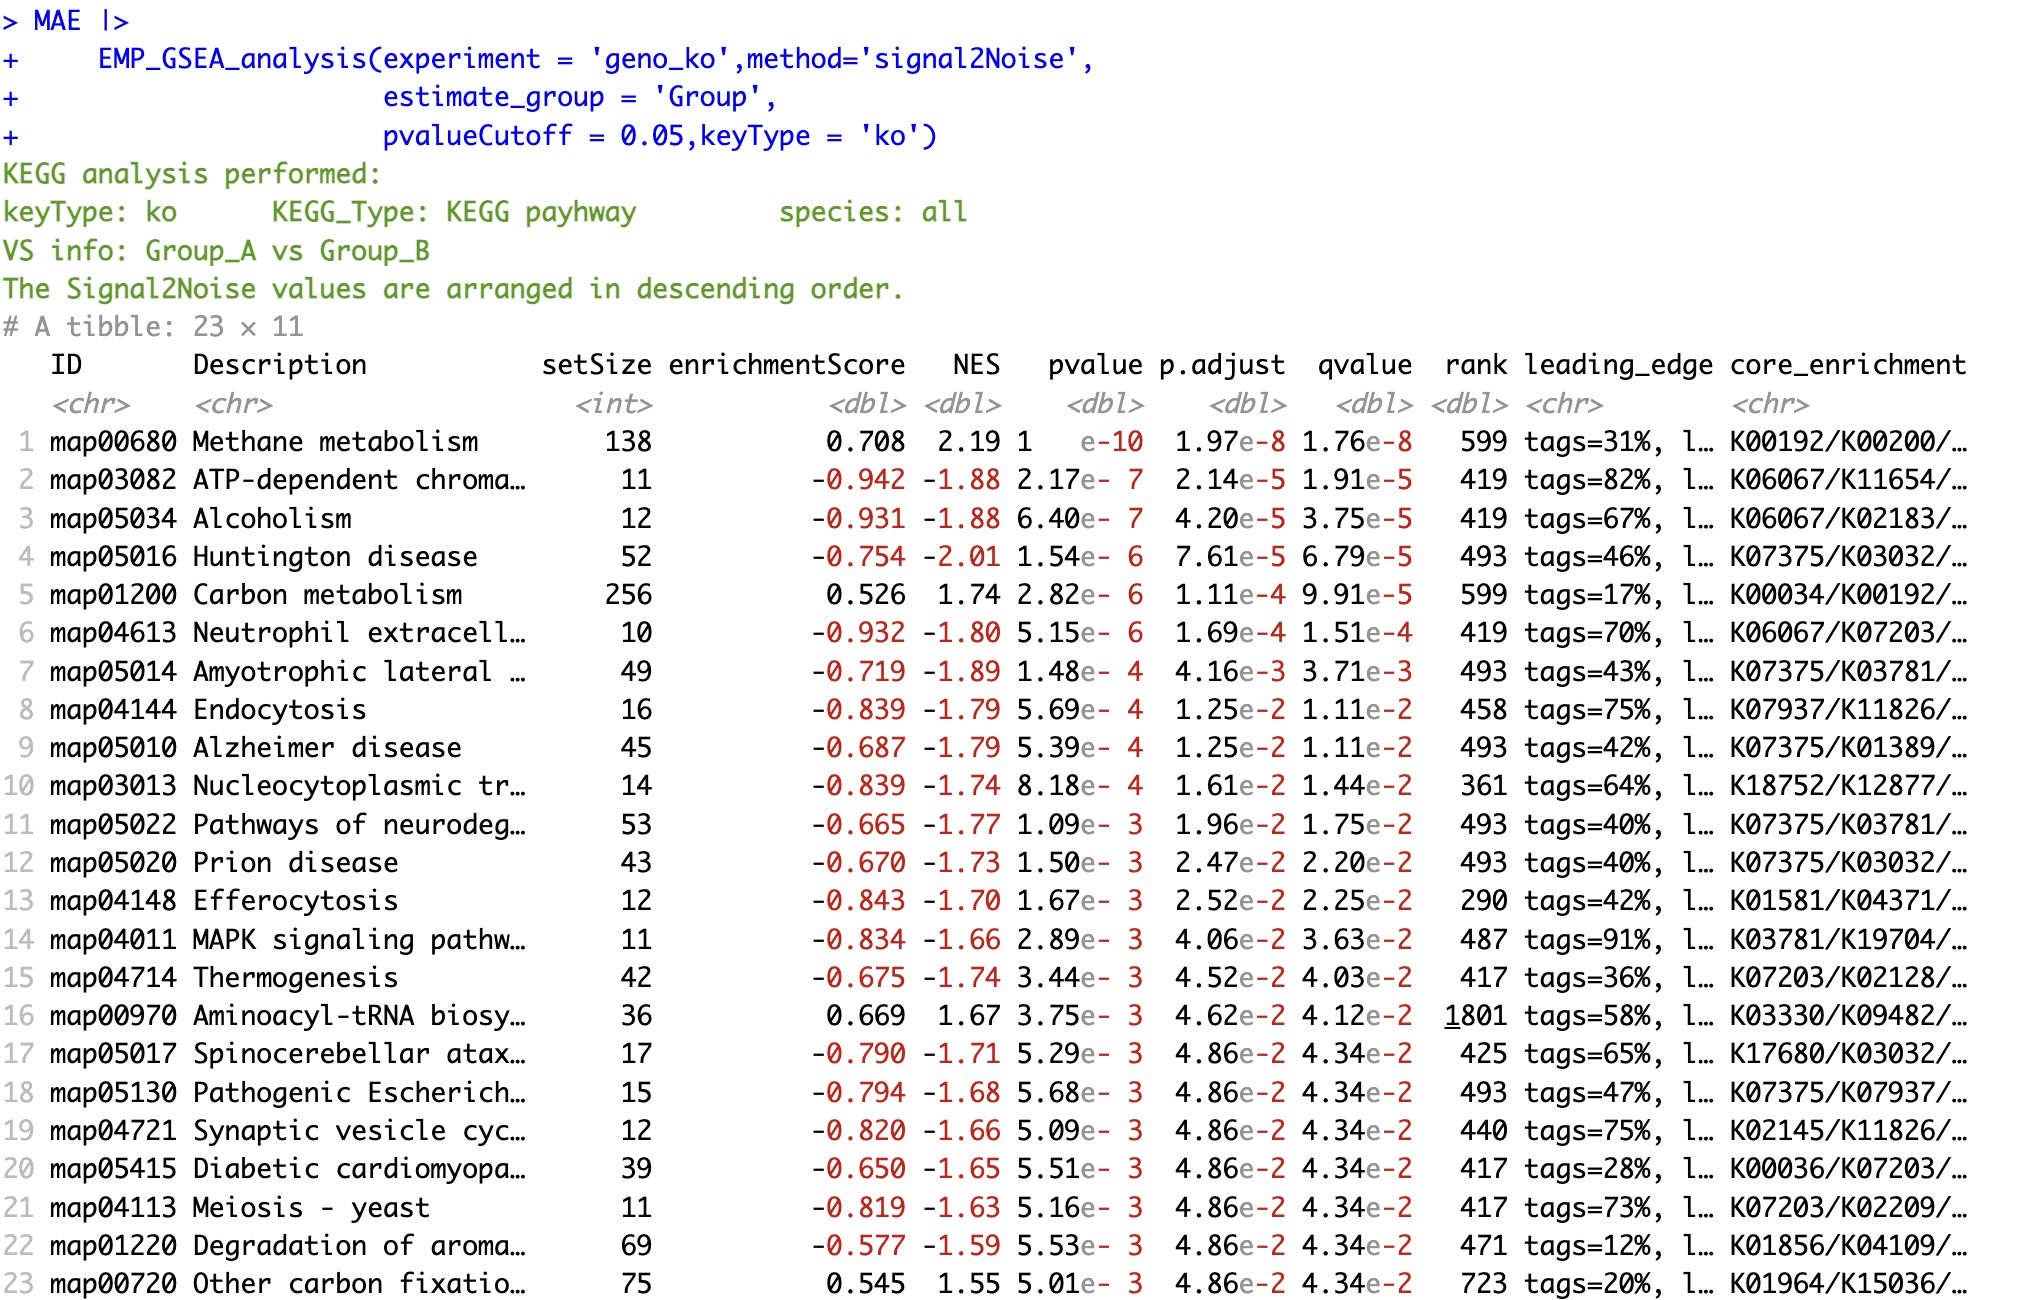
6.8.1 Sorting by signal2Noise
The signal2Noise value is a calculation provided on the official website of GSEA for sequencing genes to be analyzed.
🏷️Example:
MAE |>
  EMP_GSEA_analysis(experiment = 'geno_ko',method='signal2Noise',
                    estimate_group = 'Group',
                    pvalueCutoff = 0.05,keyType = 'ko')
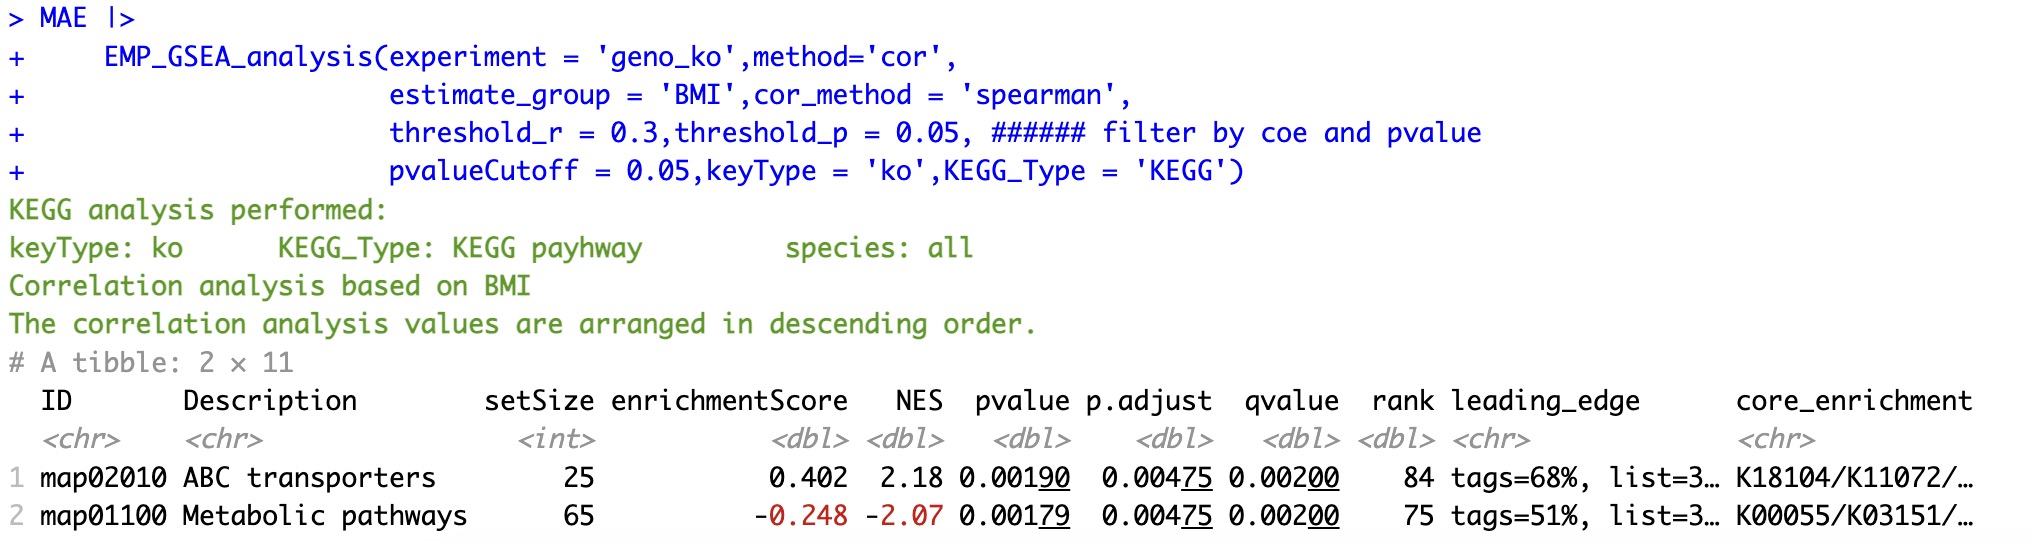
6.8.2 Sorting by relevance
In the process, it can be filtered by specifying the parameter threshold_r (absolute value threshold of the correlation coefficient) and threshold_p (p-value threshold). Specifically, if the absolute value of the correlation coefficient between a gene to be analyzed and the trait in the coldata is below the specified threshold, or if its p-value is bigger than the specified threshold, the gene will be removed from the ranking table.
🏷️Example:
MAE |>
  EMP_GSEA_analysis(experiment = 'geno_ko',method='cor',
                    estimate_group = 'BMI',cor_method = 'spearman',
                    threshold_r = 0.3,threshold_p = 0.05, ###### filter by coe and pvalue
                    pvalueCutoff = 0.05,keyType = 'ko',KEGG_Type = 'KEGG')
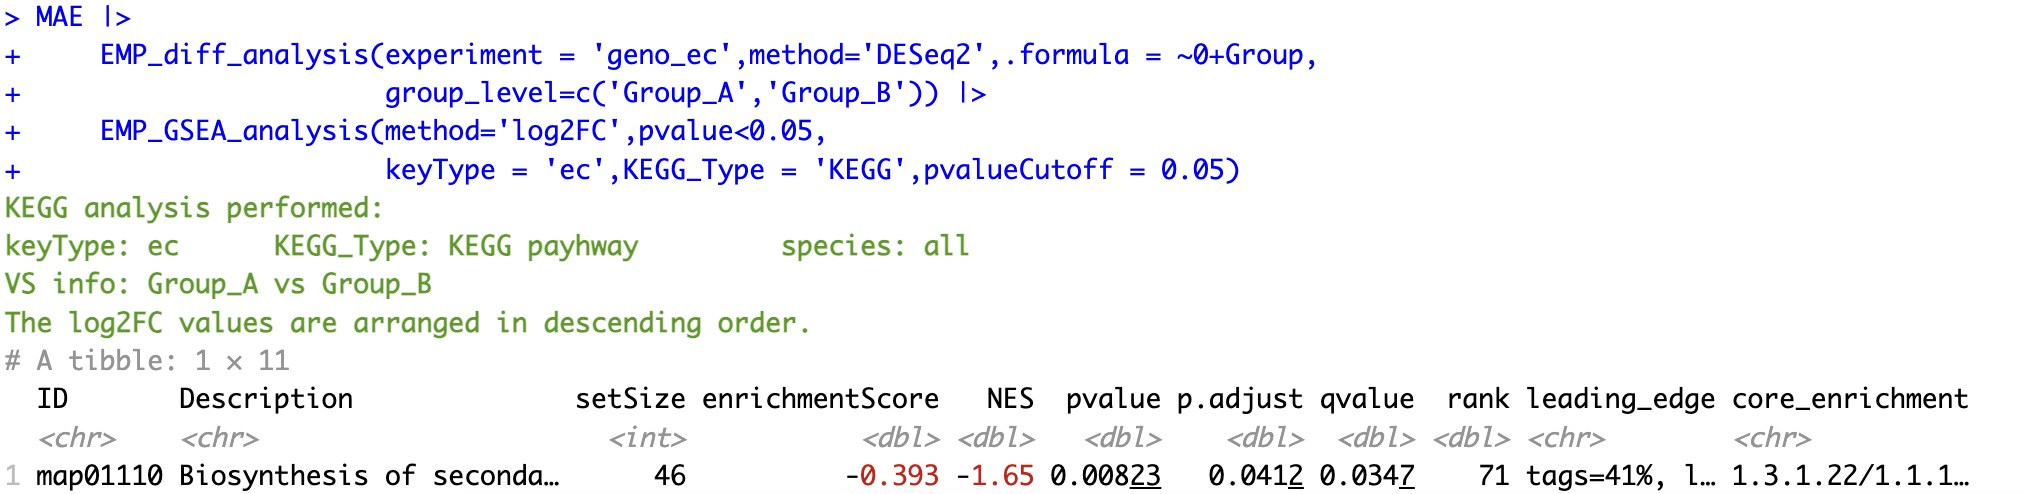
6.8.3 Sorting by log2FC
①The analysis process must be performed after the function
EMP_diff_analysis ②It is necessary to distinguish the parameter pvalue and pvalueCutoff in the module EMP_GSEA_analysis, the former corresponds to the pvalue in the analysis results of the module EMP_diff_analysis, and the latter corresponds to the corrected p-value in the analysis results of the module EMP_GSEA_analysis (e.g. fdr, bonferroni, etc.).
🏷️Example:
MAE |>
  EMP_diff_analysis(experiment = 'geno_ec',method='DESeq2',.formula = ~0+Group,
                    group_level=c('Group_A','Group_B')) |>
  EMP_GSEA_analysis(method='log2FC',pvalue<0.05,
                    keyType = 'ec',KEGG_Type = 'KEGG',pvalueCutoff = 0.05)
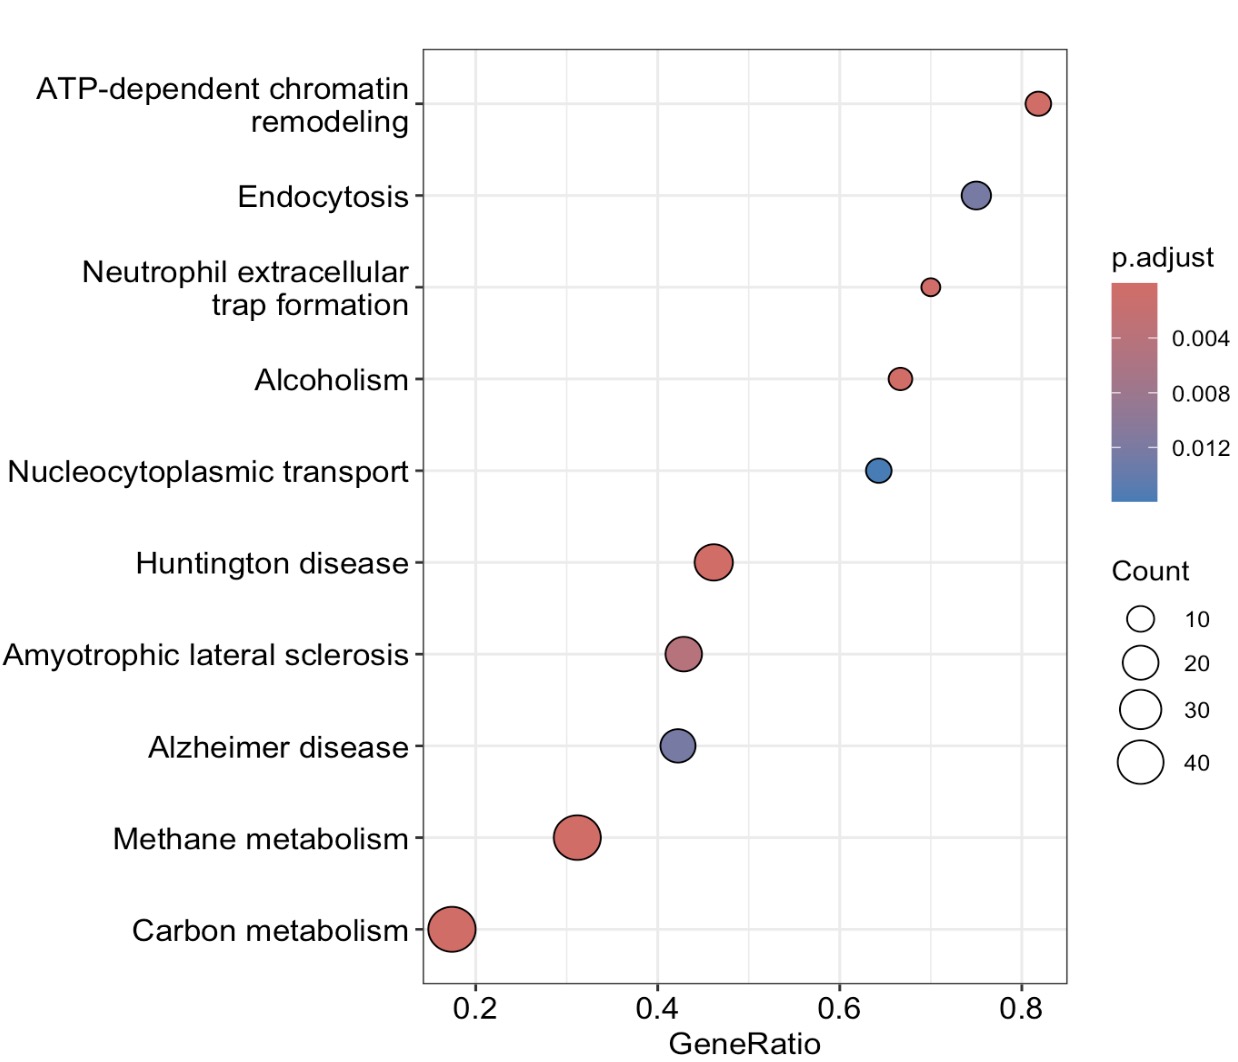
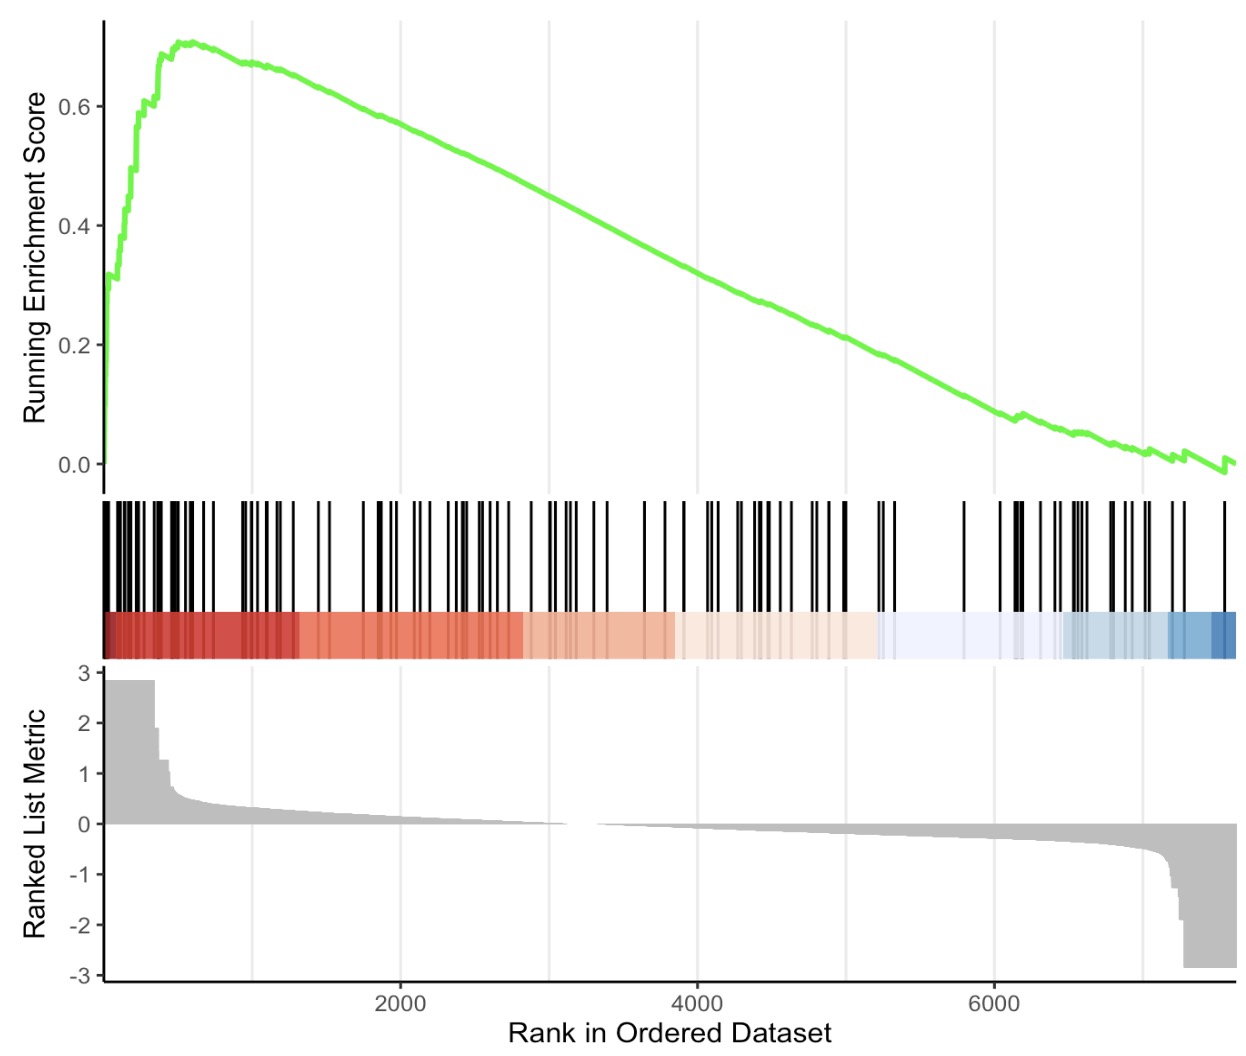
6.8.4 Visualization of GSEA result
🏷️Example:
MAE |>
 EMP_GSEA_analysis(experiment = 'geno_ko',method='signal2Noise',
                   estimate_group = 'Group',
                   pvalueCutoff = 0.05,keyType = 'ko') |>
 EMP_GSEA_plot(geneSetID='map00680')
MAE |>
  EMP_GSEA_analysis(experiment = 'geno_ko',method='signal2Noise',
                    estimate_group = 'Group',
                    pvalueCutoff = 0.05,keyType = 'ko') |>
  EMP_enrich_dotplot()